Siteimprove Analytics - Behavior maps and user pathways
Siteimprove Analytics: Behavior maps and user paths
- Gain (even more) insight into user behavior
If you want to learn more about user behavior on a specific page and gain insight into how your users navigate from A to B on your site, you can use Behavior Maps and User Journeys in Siteimprove.
- Behavior Maps
- User paths
Behavior Maps – see user interaction with your pages
Behavior maps can provide insights into how users interact with the page. Do they click on anything? Do they scroll through the page, and where on the page do they spend the most "reading time"?
Behavior maps can be set up for a single page, and it's quite easy to do. However, be aware that they do not work retroactively. Data is tracked only AFTER you have set it up.
What can you see with a Behavior map?
A Behavior map shows 4 different things:

1. Heat Map:
What attracts the user’s attention? Where does the mouse move or where do fingers on a touchscreen go?
2. Scroll Map:
How far down a page is the user willing to scroll? How many reach the bottom, and what do they look at the most along the way? This can give you a clue about what the user is interested in on your page. For example, is there a video they stop to watch, is it the text they spend the most time on, or something else on the page?
3. Click Map:
How does the user interact with interactive elements (i.e., clickable items) on the page? A click map is a quantitative measurement of the heat map. It counts how many clicks have occurred on each element. For example, you can use it to assess where on the page you should place a link. Which is the user more likely to click on? You might place the same link in two different spots on the page and see which one gets clicked more over a period of time.
4. Segmentation Map:
Here, you can compare different segments of your users. You can set up different colors to represent users from specific locations, browsers, or other criteria. This provides a graphical, color-coded view of, for example, users from various geographic areas or different browser types.
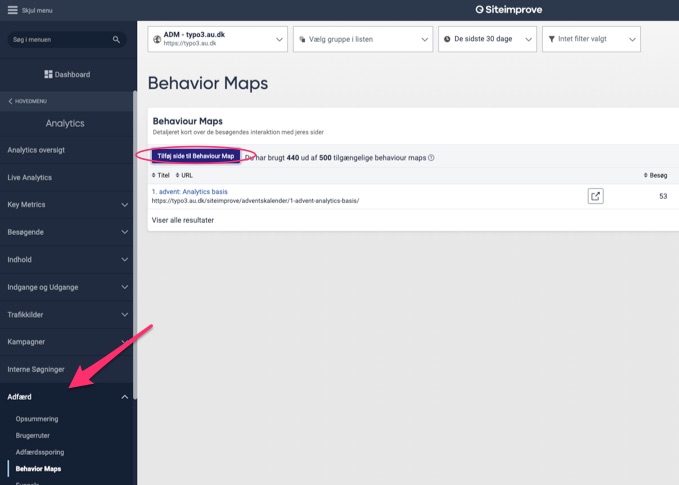
Behavior Map – How to Do It
- Click on Behavior.
- Select Behavior map.
- Click on Add page to Behavior map.
- Enter the URL of the page you want to create a Behavior map for.

You will notice at the top of the list that there is a limited number of behavior maps available per site. This means you should keep an eye on your list to see if there are any that are no longer in use and make sure to delete those you no longer need.
Once behavior maps are set up, data will start being collected. You can continuously monitor the data to track how users are interacting with your page.
User Paths – How Does the User Navigate from A to B on Your Pages?
If you have two pages on your site and want to know how users navigate between them, you can set up a user path. This can help you assess whether users are navigating as intended, for example, from a homepage to an important underlying page. Overall, user paths are useful when you want to track visitor behavior and ensure that logical paths are created to the most important destinations on your website.
They can also be used to improve poorly performing pages. For example, you can create a user path to a page that receives fewer visitors than expected, and identify the routes the few users have taken to reach that page. This can provide insight into where users might have expected to find the content.
Creating a user path is quite simple, and unlike behavior maps, you get data immediately.
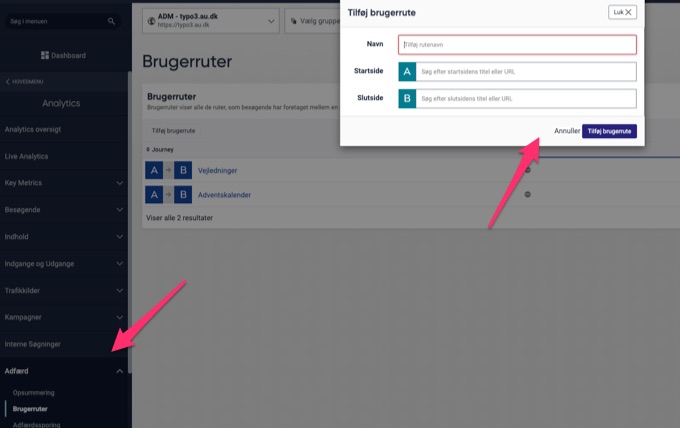
Create a User Path:
- Click on Behavior
- Select User Paths
- Add User Path
- Enter the URL for Page A and Page B

You will then be able to see how many and which steps users take to get from A to B.