Siteimprove Analytics basis
Siteimprove Analytics basis – Tips and tricks
It doesn’t have to be either difficult or time-consuming to find data on your visitors' behavior. However, it can be very useful and provide valuable insights into how you can improve the user experience for your visitors.
We have compiled a handful of useful widgets/features from Siteimprove into a dashboard we’ve called Analytics Basics. You can open the dashboard directly in Siteimprove and select your own site/group.
Open Analytics Basis Dashboard in Siteimprove
This should help you with the following missions, which we explain in detail below:
- Are we getting visits to our site (number of page views)?
- Where do they come from, and where do they go afterward (tracking user behavior)?
- Do they stay on the site (bounce rate), and can they find our content (navigation depth and internal searches)?
Page Views and Behavior Tracking
Are we getting visits, and how does the user navigate before and after?
The first widget on the dashboard provides a graphical overview of the number of page views for your selected site or group.
Next is the "Page Views for All Pages" widget. It gives you an overview of the number of page views on your site for the past month. You can also find data for a specific area or page by entering the URL in the field at the top right. For example, if you enter “/about,” you will get data for all pages under /about, or if you enter a specific URL, you will see data for that particular page.
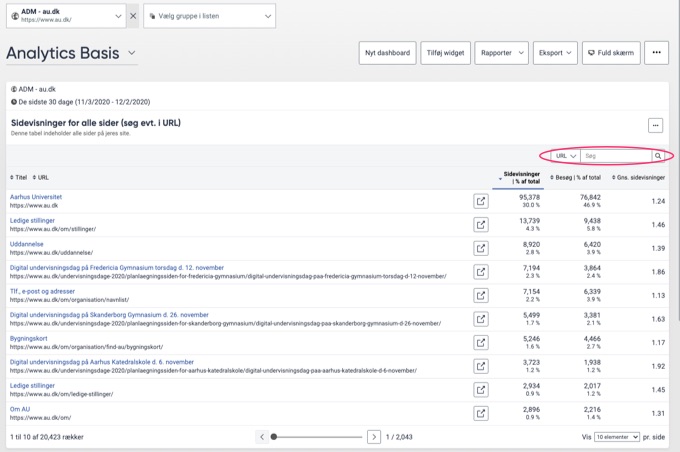
If you click on a specific page, you will enter a detailed view, which Siteimprove calls a "Page Summary" or "Page Inspector" for that particular page. Here, you have many options, and it can seem overwhelming.
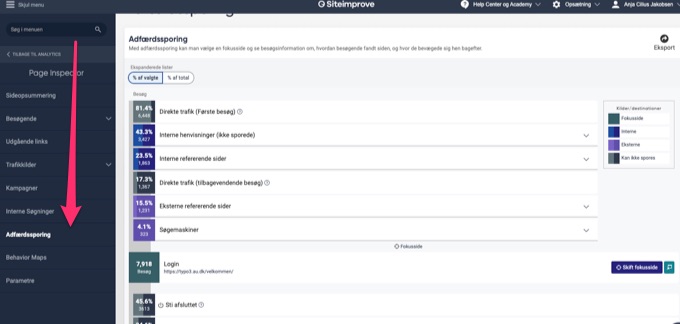
Our tip is to look at "Behavior Tracking" in the left menu. This will give you a nice graphical overview of how the user arrived at the page and where they go next. This can be very useful data.
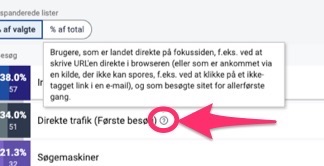
TIP: If you find the terms in Siteimprove a bit difficult to understand, such as what "Direct Traffic" or "Path Completed" means, Siteimprove often provides an explanation of the term if you hover your mouse over the "?" next to it.
Bounce Rate, Navigation Depth, and Internal Searches
Are we able to keep users engaged on the site — making the information interesting and encouraging them to continue exploring? Is it difficult for users to find the content they’re searching for, and what exactly are they looking for?
It's important not only to know how many page views your pages have, but also whether users are actually spending time on your site. This can be indicated by the "Bounce Rate," which shows the percentage of users who leave the site immediately after viewing the page in question. It can be useful to monitor which pages have the highest bounce rates, as this may indicate that the page does not encourage users to continue exploring. In other words, we are failing to maintain user interest.
However, a high bounce rate might also mean that the page provides exactly the information users need. For example, a contact page or a login page often has a high bounce rate. The user arrives on the page with a specific goal, such as "Find phone number," finds it, and then exits the page.
What you should watch for is whether the bounce rate is high on pages where you would like users to continue, such as a homepage or another navigation page. If so, this is a warning sign that you should consider changing the page and perhaps investigate what users expect to find there and why they are not finding it.
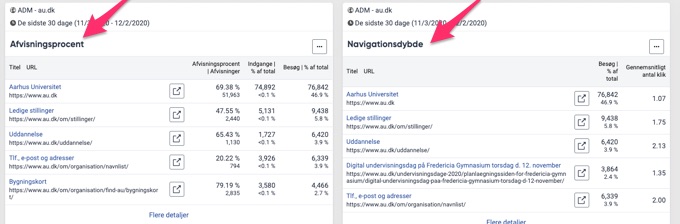
"Navigation Depth" tells you the average number of clicks a user has needed to reach a specific page. This can also indicate if the page is difficult for users to find (if many clicks were required to reach it). A page with a high average number of clicks is hard to find, and you should consider linking to it from more frequently visited or more relevant pages.
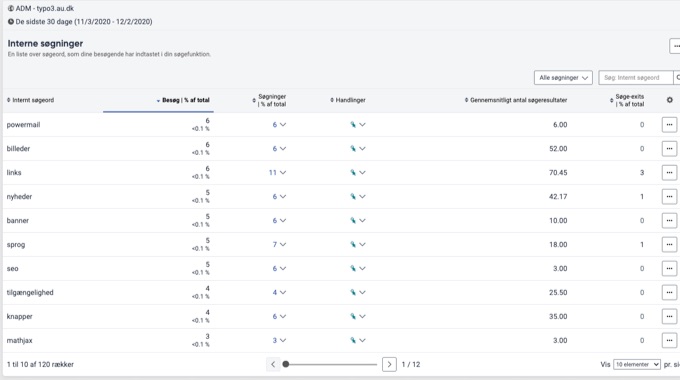
"Internal Searches" is another truly valuable widget. It shows you the search terms users have used on your site (if it has a search function). This provides insight into what users are typically looking for on your site.
What's next?
With these widgets/features, you already have a good understanding of how users navigate your site, enabling you to make informed decisions. You might consider making some changes and observing whether the data shifts as a result.
Is the amount of data on the dashboard overwhelming?
Do you find that you’re seeing too many pages that are irrelevant to you?
It is possible to create “Groups” for selected pages/URLs on your site if you want to view data for a smaller subset of pages. Contact your websupport, sand they can assist with this.
You can also use filters. This is a bit more advanced, but essentially, you can set up filters based on various parameters to either include or exclude certain content (e.g., from a specific traffic source or device). You can read more about this on Siteimprove.
To create a new filter, you need to contact your local websupport.
Receive the Dashboard as a Report
If you like the information mentioned here, you can sign up to receive the dashboard as a report (monthly/quarterly/semi-annually) directly in your inbox.
Send an email to: typo3@au.dk, specifying which site/group and the frequency you wish to receive the report. You can also visit the Dashboard at any time to check data for a given period yourself.